RELATED: Tobacco-Related Health Risks Dashboard
The interactive map below shows a variety of tobacco-related information from 2022, as well as proximity to schools. Click the MAP SETTINGS button to add or remove data layers. Click any marker or polygon on the map for details.
Click the magnifying glass button (upper left on map) to enter a city name. Use the autocomplete text to make your selection. The map will then zoom to the location of interest.
×
Select Map Layers to Display:
TOBACCO RETAILERS
SCHOOLS (public + private)
BASE LAYERS
Tobacco Retail Statistics
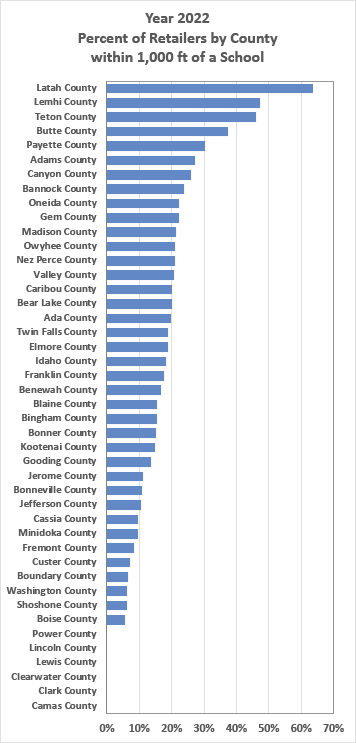
By County:
| Total tobacco retailers (includes vape) | |
| Vape retailers | |
| Retailers within 1,000 ft of a school | |
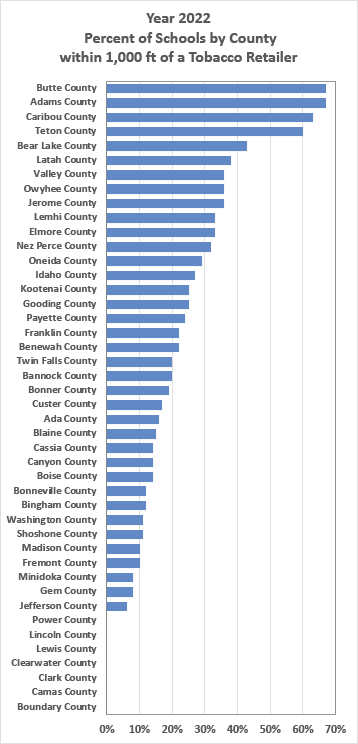
| Schools within 1,000 ft of a tobacco retailer | |
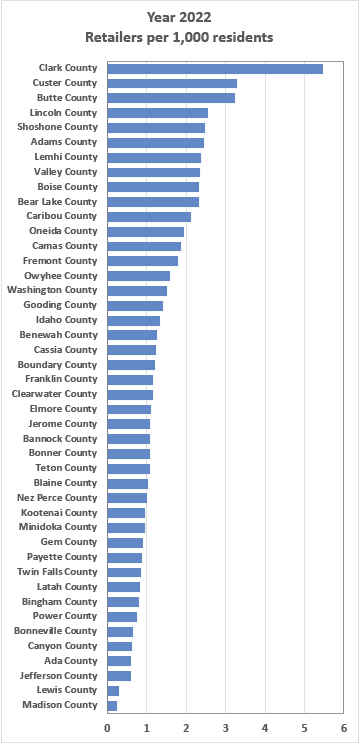
| Retailers per 1,000 residents | |
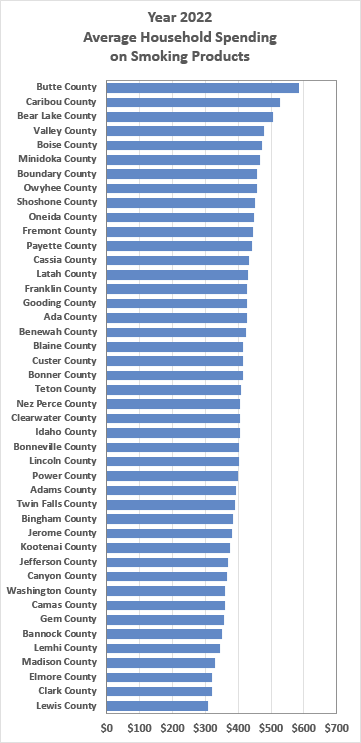
| Avg Household Spending on Smoking Products (2022) |
By Public Health District:
| Total tobacco retailers (includes vape) | |
| Vape retailers | |
| Retailers within 1,000 ft of a school | |
| Schools within 1,000 ft of a tobacco retailer | |
| Retailers per 1,000 residents |
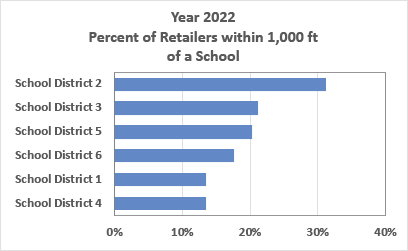
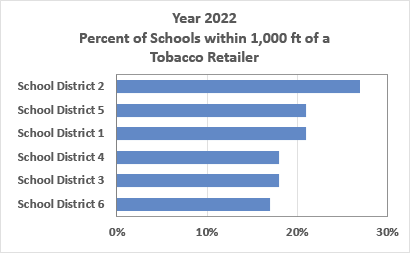
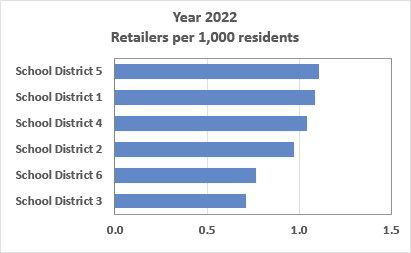
By School District:
| Total tobacco retailers (includes vape) | |
| Vape retailers | |
| Retailers within 1,000 ft of a school | |
| Schools within 1,000 ft of a tobacco retailer | |
| Retailers per 1,000 residents |
County Rankings
School District Rankings